Dashboard #
This is a dashboard page for a business that provides services, likely related to marketing or online presence. It gives a snapshot of the business’s performance over the last 7 days.
This dashboard serves as a valuable tool to quickly assess the business’s performance and identify areas for improvement.
Dashboard into two parts, offering a user-friendly interface for performing agency tasks and accessing valuable data insights to optimize agency operations and decision-making.
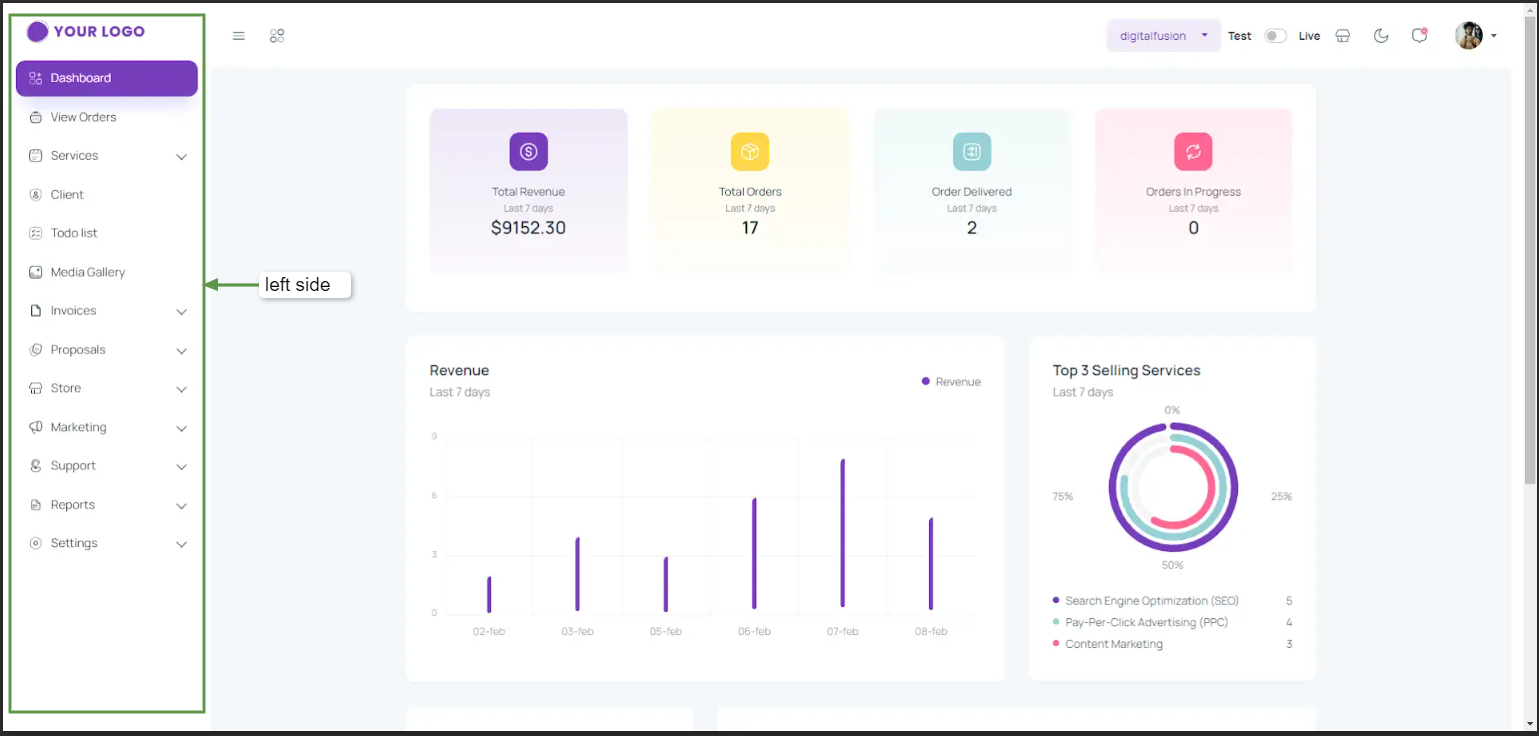
Left side: #
In the left column of the dashboard, users have access to a range of essential tools and features. They can create and manage services, facilitate client interactions, handle orders, generate quotations, manage support tickets, collaborate with their team, oversee financial transactions, and efficiently manage documents. This section serves as the operational hub where day-to-day agency activities are initiated and monitored.
Right Side: #
This dashboard page provides an overview of a business’s performance. It displays key metrics such as total revenue, total orders, order delivered, orders in progress, and top 3 selling services. The dashboard is divided into different sections:
– Top Section: It shows the total revenue, total orders, orders delivered, and orders in progress for the last 7 days.
– Revenue Section: This section displays a chart showing the revenue generated over the last 7 days.
– Top 3 Selling Services Section: This section shows a pie chart that represents the top 3 selling services and their corresponding number of orders.
– Order Performance Section: This section presents the total number of orders, delivered orders, orders in progress, and canceled orders for the last 7 days.
– Recent Orders Section: This section displays a list of recent orders with details such as service name, client name, and creation date.


